Google Ads advertisers have lost the ability to create new Expanded Text Ads (ETAs) in the accounts they manage, with all future ads creations being limited to the Responsive Search Ad (RSA) format. Whilst the format is richer, more flexible, and better suited to the changes in match types we saw earlier in the year, it faces some limitations in reporting and testing. For each ad asset, Google Ads provides data on impressions and a seemingly arbitrary score, but nothing on how these assets (up to 15 headlines and 4 descriptions) perform as a combination, or how the score is achieved.
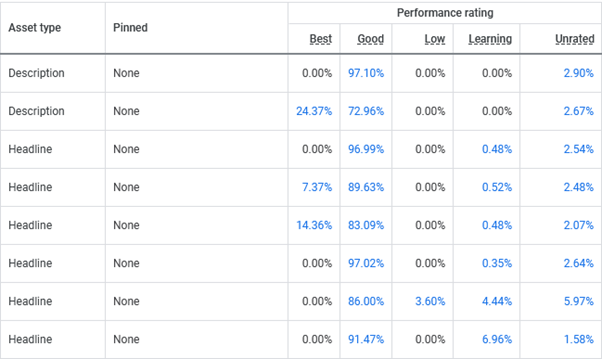
Asset performance report as provided by Google Ads
The absence of click data against the assets that make up the different RSAs (Responsive Search Ads) makes it difficult to assess and compare their performance in terms of CTR. The presence of just impression data means that only ad impression show rate can be calculated accurately.
To calculate the show rate, we have created the Asset Show Rate Calculator based on an ad report and an asset report. This tool will show which assets Google Ads is showing more often than others, along with the share of total impressions that this asset accounts for.
To use this tool, simply create a copy of the sheet and download an ad report from Google Ads for any given time range (ideally since the last time an ad copy optimisation was done, or ad copy was significantly changed), filtering by ad type = RSA and Status enabled, with only Impressions, Clicks and Cost as columns, as well as an asset report for the same date range, and paste them in the relevant sheets exactly as downloaded.
The output of the processor, in the tab "Results", shows how many times the asset was eligible to be shown (how many times an ad featuring it delivered impressions), how many times this particular asset was shown, the show rate, as well as how often the ad has shown for the whole account.
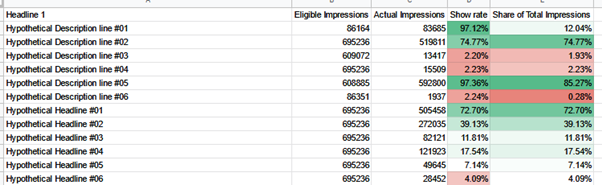
Asset Show Rate Output
The asset show rate provides an indication of which assets Google Ads prefers to show your audience. Whilst we can't see which queries are prompting these impressions, this tool highlights which assets could be removed without affecting account performance. For instance, from the above table, Hypothetical Description line #03, #04 and #06 could be reworked or replaced for a new set of assets without negatively impacting performance.
To help you compile and assess all historical ad performance, we've created a second tool. Our Asset Ranker condenses all historical ad headlines and descriptions into a simple list with total amount of impressions delivered and clicks driven. The list also features the assets' average CTR and their rank based on this KPI, helping identify the better performing assets.
To use the Asset Ranker, create a copy of the sheet and paste in a Google Ads report with all historical RSAs and ETAs along with their impressions, clicks and cost. The processor will output a ranking of all assets based on their individual CTRs, both for headlines and descriptions, along with a total click ranking, which will help you find the assets that contribute the best CTR.
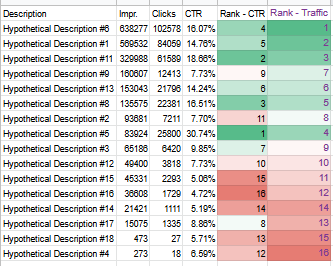
Asset Rank Output
By combining the use of these two tools, you will isolate assets that most positively impact campaign CTR from those that affect it negatively. By creating new copy using the top performing assets, and reworking or removing the lower performing assets, you will be able to drive account CTR upwards, and increase click share and competitiveness of the account.
We hope you'll find use to these tools. We've already seen increments in CTR on the accounts on which these have been used at In Digital, with some accounts seeing as much as a 10% increase in CTR across broad generic campaigns.
Pierre Daudré-Vignier, Senior Account Manager
Ready to improve your performance?
Reach out to one of our team to learn more about our services and how we can help your business thrive.
Talk to us